
PSS-10 scoring: reversing items, adding the total, and why there are no cut-offs
To score the PSS-10, reverse items 4, 5, 7, and 8, then add all ten item scores. The total runs from 0 to 40, and higher means more perceived stress. [1] The developers state that it is not a diagnostic instrument and there are no score cut-offs. Scores can only be compared within your own sample. [2]
How do you calculate a PSS-10 total?
Score each answer from 0 (never) to 4 (very often). For items 4, 5, 7, and 8, flip the number: 0 becomes 4, 1 becomes 3, 2 stays 2, 3 becomes 1, and 4 becomes 0. Then add the ten numbers. [1] LuriaLab says it applies the reversal and shows the total. [1]
Worked example
These are invented answers. The table shows each raw answer and how it counts after reversal.
| Item | Raw answer (0 to 4) | Reversed? | Counts as |
|---|---|---|---|
| 1 | 2 | No | 2 |
| 2 | 3 | No | 3 |
| 3 | 2 | No | 2 |
| 4 | 1 | Yes | 3 |
| 5 | 2 | Yes | 2 |
| 6 | 3 | No | 3 |
| 7 | 1 | Yes | 3 |
| 8 | 2 | Yes | 2 |
| 9 | 3 | No | 3 |
| 10 | 2 | No | 2 |
Are there low, moderate, and high bands?
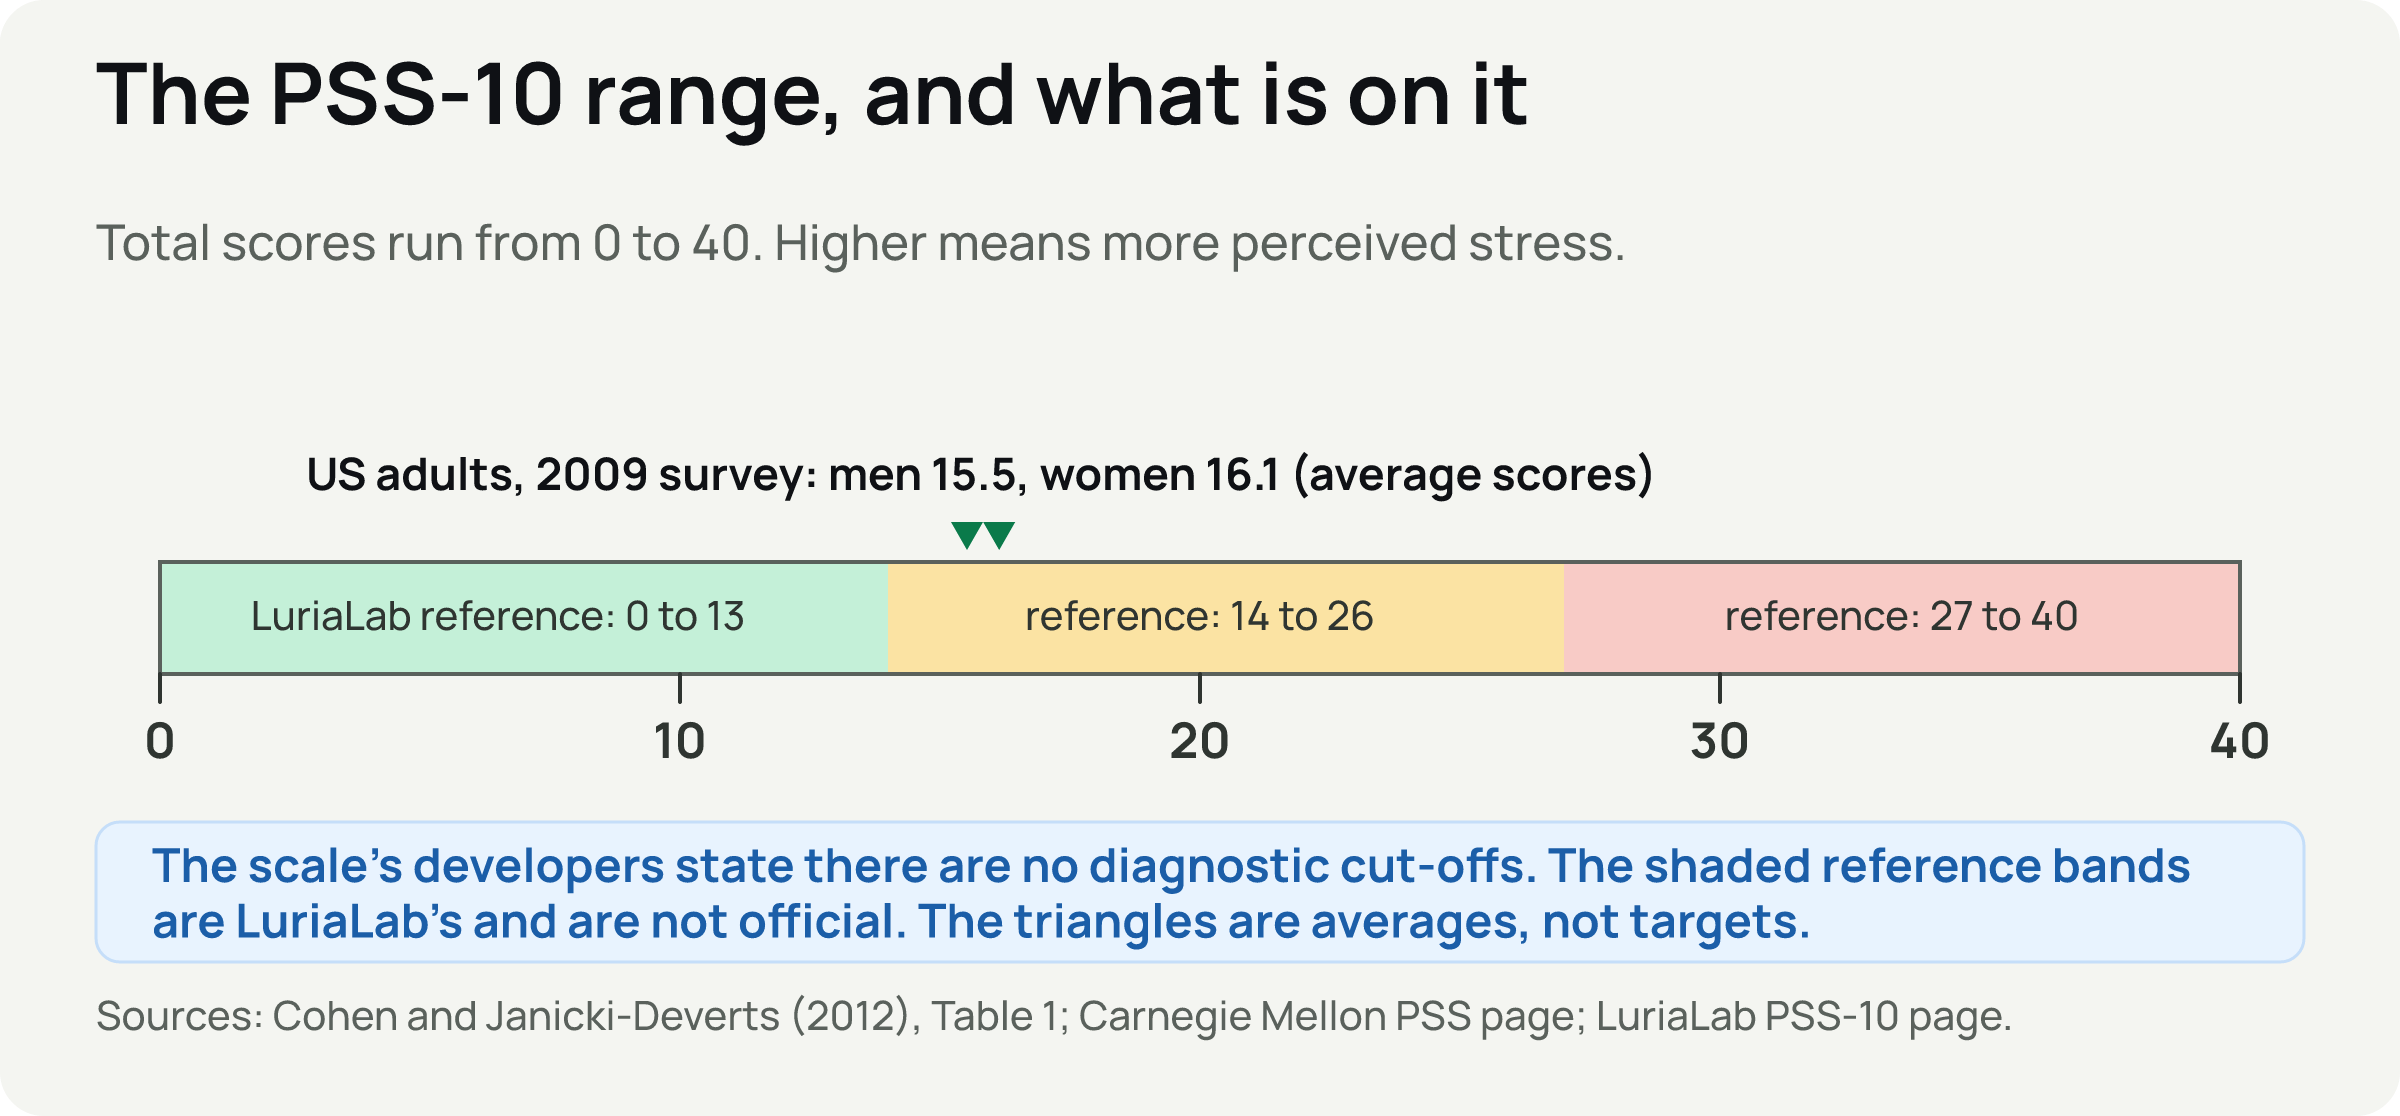
The PSS-10 has no official low, moderate, or high bands. LuriaLab shows three reference bands, 0 to 13, 14 to 26, and 27 to 40, and says they are not official clinical cut-offs. [1] The developers state there are no cut-offs and that scores can only be compared within your own sample. [2] If you see bands on another website, treat them as a convenience, not a diagnosis.
What are typical scores?
Average PSS-10 scores reported in three US surveys of adults: [3]
| Survey | Men | Women |
|---|---|---|
| 2009 (internet, about 2,000 adults) | 15.5 | 16.1 |
| 2006 (internet) | 14.5 | 16.1 |
| 1983 (telephone) | 12.1 | 13.7 |
Scores were higher among women and among younger adults, people with less education and income, and unemployed people, and lower among retired people. The 1983 survey used telephone interviews and the later ones the internet, so the authors could not say whether the rise reflected real change or a difference in method. [3]
These averages describe a population. They are not a target, and a score above or below them tells you little by itself.
Is a score of 20 or 26 normal?
The PSS-10 has no official answer to what is normal. A score of 20 is above the 2009 US averages and one of 26 is further above. Whether either matters to you depends on what is behind it, how long it has lasted, and what it is affecting. The scale's developers do not define a "normal" range for individuals. [2] Use the number to start a conversation, not to settle one.
Why is my result different from a simple sum?
If you added your raw answers without reversing items 4, 5, 7, and 8, your total will be wrong. That is the usual reason. Another is a different version, such as the 14-item or 4-item scale, which have different ranges. [2]
Is the result a percentage or a probability?
No. It is a score on a 0 to 40 scale. It does not give the chance of having a condition, and it does not predict illness or performance for you.
Common questions
What is a high PSS-10 score?
The PSS-10 has no official threshold for a high score. LuriaLab's reference bands (27 to 40 as its top band) are not official clinical cut-offs, and the developers state there are none. [1][2]
Which PSS-10 items are reverse-scored?
Items 4, 5, 7, and 8 are reverse-scored. [1]
What is the highest possible PSS-10 score?
The highest possible PSS-10 score is 40. The range is 0 to 40. [1]
Sources and further reading
These links open external research and health-information websites.
- LuriaLab: Perceived Stress Scale (PSS-10) test page
Ten items, 0 to 4 scale, past month, reverse-scored items 4, 5, 7, and 8, total 0 to 40, reference bands, age 12+, and disclaimers. Read on 24 October 2026. - Carnegie Mellon University: The Perceived Stress Scale
The developers' page: versions, "not a diagnostic instrument; there are no score cut-offs", comparison within your own sample, time-frame comment, and translations. Read on 24 October 2026. - Cohen and Janicki-Deverts (2012): Who's stressed? Distributions of psychological stress in the United States in probability samples from 1983, 2006, and 2009. Journal of Applied Social Psychology, 42, 1320-1334
PSS norms from three US surveys, with means and standard deviations by demographic group. The surveys were supported by Johnson & Johnson, which the authors say played no role in the analysis; the authors consult for it on stress measurement. Full text read.
This page is educational. A questionnaire score cannot establish a diagnosis or explain the cause of your symptoms. If you are struggling, speak with a doctor or mental health professional, whatever your score. Read when to get help for work stress or find a helpline in your country.